Observability in ASP.NET Core
Adding instrumentation to ASP.NET Core Web APIs
11 min readIn this post, we’ll take a look at adding instrumentation to an ASP.NET Core Web API, using .NET 8, minimal APIs, and OpenTelemetry. If you’re new to Observability, or why it may be relevant, check out my previous blog post An Introduction to Observability.
The code referenced throughout this post is available on GitHub.
Getting Started With Logging
First things first, create a new ASP.NET Core Web API. I’m using the Native AOT template for other experimentation, which may get a post of its own soon.
dotnet new sln -n DotnetAotApi
dotnet new webapiaot -n DotnetAotApi.Api
dotnet sln add DotnetAotApi.Api
Next, we’ll need to install a few Nuget packages for our instrumentation.
cd DotnetAotApi.Api
dotnet add package OpenTelemetry.Extensions.Hosting
dotnet add package OpenTelemetry.Exporter.Console
dotnet add package OpenTelemetry.Exporter.OpenTelemetryProtocol
The .NET Core ecosystem has rather strong support for automatically, and
manually, instrumenting applications with logs, metrics, and traces. Logging is
performed via the ILogger interface, which has extension methods depending on
the log level desired (e.g. ILogger.LogInformation()). Logs, by default, will
be output to stdout - typically the terminal - which we can read, or other
programs can then do something with. If we want to alter this behavior, we can
register a “Logging Provider” for the application.
To do this, I’ll create a new directory to hold our application’s configuration,
called Configuration. In there, create a class called LoggingExtensions for
an extension method on ILoggingBuilder which will format logs according to the
OpenTelemetry specification, and export them to a service via the OpenTelemetry
Protocol (OTLP) to a service we’ll configure in a bit. For now though, we’ll
export logs to the console.
using OpenTelemetry.Logs;
using OpenTelemetry.Resources;

namespace DotnetAotApi.Api.Configuration;

public static class LoggingExtensions
{
    public static ILoggingBuilder WithLoggingConfiguration(
        this ILoggingBuilder logging,
        IWebHostEnvironment environment
    )
    {
        logging.AddOpenTelemetry(builder =>
        {
            // Give our application a name that can be queried in the logs
            var resourceBuilder = ResourceBuilder
                .CreateDefault()
                .AddService(environment.ApplicationName);
            builder.SetResourceBuilder(resourceBuilder);

            // Export logs via OTLP.
            // builder.AddOtlpExporter();

            // Alternatively, to output logs to the console:
            builder.AddConsoleExporter();
        });

        return logging;
    }
}
We can then register our new logging provider in Program.cs.
using DotnetAotApi.Api.Configuration;

var builder = WebApplication.CreateSlimBuilder(args);

builder.Logging.WithLoggingConfiguration(builder.Environment);
Great! Now we have a way to get logs out of the system, let’s actually create a
log message. There’s a few ways we can output logs in .NET Core. The first is
using the aforementioned extension methods, like ILogger.LogInformation().
However, the interface they provide can cause our application to allocate more
memory than it needs, as every argument to the method must be an object.
Integers, for example, must be placed on the heap before the logger can do
anything with it.
To get around this, newer versions of .NET Core have a source generator for log
messages, where code will be generated at compile time for an interface you
specify. Integers can stay integers, but this pattern also pushes you towards
standardizing log messages throughout the application. Let’s give it a shot. In
Program.cs, add the following:
var app = builder.Build();
// ...
ProgramLogs.StartingApplication(app.Logger);

app.Run();

// This class must be partial so an implementation can be generated
internal static partial class ProgramLogs
{
    // This attribute tells dotnet to generate the source for a log message
    [LoggerMessage(LogLevel.Information, "Starting API...")]
    public static partial void StartingApplication(ILogger logger);
}
If you run the application, you should see an output similar to this:
LogRecord.Timestamp:               2023-12-19T00:59:03.5544886Z
LogRecord.CategoryName:            DotnetAotApi.Api
LogRecord.Severity:                Info
LogRecord.SeverityText:            Information
LogRecord.FormattedMessage:        Starting API...
LogRecord.Body:                    Starting API...
LogRecord.Attributes (Key:Value):
    OriginalFormat (a.k.a Body): Starting API...
LogRecord.EventId:                 72751487
LogRecord.EventName:               StartingApplication

Resource associated with LogRecord:
service.name: DotnetAotApi.Api
service.instance.id: 8a588fbe-8300-422f-8f3b-c5318e22b50a
It’s certainly not the prettiest log in the world, but we can see our message, as well as a peek behind the scenes at what makes OpenTelemetry useful: structured logging. Each of the values we want to print in logs are output with a name associated to it. This will come in handy later when querying logs.
Let’s give structured logging a shot by changing the ProgramLogs class to the
following:
internal static partial class ProgramLogs
{
    [LoggerMessage(LogLevel.Information, "Started API at {Timestamp}...")]
    public static partial void StartingApplication(ILogger logger, DateTimeOffset timestamp);
}

// call it with
ProgramLogs.StartingApplication(app.Logger, DateTimeOffset.UtcNow);
Here, we’ve added a new DateTime parameter. The name of this parameter is
important, and should be the camel-case equivalent of whatever is in braces
({Timestamp} in this example). The source generator will then produce the most
optimal code it can to serialize the DateTime to a string for the log’s
output.
Running the application again, we can see the following output:
LogRecord.Timestamp:               2023-12-19T01:20:39.4340655Z
LogRecord.CategoryName:            DotnetAotApi.Api
LogRecord.Severity:                Info
LogRecord.SeverityText:            Information
LogRecord.FormattedMessage:        Started API at 12/19/2023 01:20:39 +00:00...
LogRecord.Body:                    Started API at {Timestamp}...
LogRecord.Attributes (Key:Value):
    Timestamp: 12/19/2023 01:20:39 +00:00
    OriginalFormat (a.k.a Body): Started API at {Timestamp}...
LogRecord.EventId:                 72751487
LogRecord.EventName:               StartingApplication

Resource associated with LogRecord:
service.name: DotnetAotApi.Api
service.instance.id: b5d88f45-dae0-45d6-802c-88cd84e071d1
Note how Timestamp in LogRecord.Attributes has serialized our timestamp!
Another important thing to note is LogRecord.Body. This contains the original
string format we used to define the source generator. Having this around is
useful as we can query to see every instance of a log using that template, to
get all the values we replaced it with.
Having our console spammed with 14+ lines of text for every log message isn’t
ideal though. Let’s change the exporter to utilize the OpenTelemetry exporter in
LoggingExtensions.cs.
            // Export logs via OTLP.
            builder.AddOtlpExporter();

            // Alternatively, to output logs to the console:
            // builder.AddConsoleExporter();
Running the application again, we still see our default logs. If you want to
disable them, call ILoggingBuilder.ClearProviders() before registering the
OpenTelemetry Logging Provider.
Metrics
Now that we have logging wired up for helpful context about our application, it’s time to add some hard & fast data points. To do this, we’ll need to add another Nuget package:
dotnet add package OpenTelemetry.Instrumentation.AspNetCore --prereleaseNext up, let’s create another class in our configuration directory, called
OpenTelemetryExtensions. This time, we’ll create an extension method on
IServiceCollection to register services for metrics.
using OpenTelemetry.Exporter;
using OpenTelemetry.Metrics;
using OpenTelemetry.Resources;

namespace DotnetAotApi.Api.Configuration;

public static class OpenTelemetryExtensions
{
    public static IServiceCollection WithOpenTelemetry(this IServiceCollection services)
    {
        // Allows OpenTelemetry to be configured via appsettings.json
        services.AddOptions<OtlpExporterOptions>();

        services
            .AddOpenTelemetry()
            // Similar to logging, give tag metrics with our service's name
            .ConfigureResource(
                builder =>
                    builder
                        .AddService("DotnetAotApi.Api")
                        .AddTelemetrySdk()
            )
            .WithMetrics(
                builder =>
                    builder
                        // Export any metrics from a meter with this name
                        .AddMeter("DotnetAotApi.Api")
                        // Automatically colllect metrics from ASP.NET Core
                        .AddAspNetCoreInstrumentation()
                        .AddOtlpExporter()
            );

        return services;
    }
}
Now, wire this up in Program.cs, placing the following before the call to
builder.Build().
builder.Services.WithOpenTelemetry();Next, let’s add the options needed to appsettings.Development.json to
configure the OTLP exporter for later.
{
  "Logging": {
    "LogLevel": {
      "Default": "Information",
      "Microsoft.AspNetCore": "Warning"
    }
  },
  "Otlp": {
    "Endpoint": "http://localhost:4317"
  }
}
Before we go further, metrics are often a cross-cutting concern and need to be
called from many places throughout the project. We want to be able to output
unique metrics with standard names. To do this, we’ll add a new directory called
Observability with a class called OtelConfig. We’ll make this class static
so it can be obtained, and called from anywhere. Within it, we’ll create a
Meter - an object provided by .NET Core for collecting various types of
metrics. We’ll also define our service’s name as a constant for later use.
using System.Diagnostics;
using System.Diagnostics.Metrics;

namespace DotnetAotApi.Api.Observability;

public static class OtelConfig
{
    public const string ServiceName = "DotnetAotApi.Api";

    public static Meter Meter = new(ServiceName);

    // Registered users should only increase over time
    public static Counter<long> RegisteredUsers = Meter.CreateCounter<long>("users.registered");

    // Active todos could go up or down over time
    public static UpDownCounter<long> ActiveTodos = Meter.CreateUpDownCounter<long>("todos.active");
}
Since we’ve defined a constant for our service’s name, let’s go replace any
occurrence of it in OpenTelemetryExtensions.cs with the constant
OtelConfig.ServiceName. Additionally, since we want to operate with this class
anywhere in our app, we can add the following line to DotnetAotApi.Api.csproj,
and we’ll never need a using statement for it.
  <ItemGroup>
    <Using Include="DotnetAotApi.Api.Observability" />
  </ItemGroup>
Now, when a new user registers somewhere in our app, we can call the following so our metric reflects the number of registered users.
OtelConfig.RegisteredUsers.Add(1);Tracing
Now we’re getting to the good stuff! We already have all the packages we’ll need
to add tracing, so let’s add the following to OpenTelemetryExtensions.cs:
            // .WithMetrics(...)
            .WithTracing(
                builder =>
                    builder
                        .AddSource(OtelConfig.ServiceName)
                        .AddAspNetCoreInstrumentation()
                        .AddOtlpExporter()
            );
The .NET Core ecosystem deviates from the normal OpenTelemetry verbiage here a
bit, as it already had similar concepts in the System.Diagnostics namespace
before the standard was created. Traces are grouped via an ActivitySource, and
spans are created from it, called “activities”. If you’d prefer to stick with
the OpenTelemetry terminology, there’s an API shim you can install that wraps
the underlying System.Diagnostics APIs with the normal terminology. In this
post, however, I’ll be using the normal .NET Core APIs.
Let’s add an ActivitySource so we can create spans. Add the following line to
OtelConfig.cs:
public static ActivitySource Source = new ActivitySource(ServiceName);Spans are meant to collect execution time for the code they contain, so
implement the IDisposable interface to enable running code before the object
is destroyed. To create a span, we can add the following API endpoint to
Program.cs:
app.MapGet(
    "/hello",
    async () =>
    {
        using var activity = OtelConfig.Source.StartActivity("Hello");
        await Task.Delay(1000);
        return TypedResults.Ok<string>("Hello, World!");
    }
);
In the example above, the span “Hello” will cover the entire request handler, collecting the duration it took for the request to be handled, and will be cleaned up once we return “Hello, World!”
Putting the pieces together
So far, we haven’t been able to see any of the fruits of our labor, as we’re exporting logs, metrics, and traces to some non-existent service. It’s time we fixed that, and take a look at some pretty graphs!
To do this, we’ll setup a stack consisting of: Loki for logs, Prometheus for
metrics, Tempo for traces, and Grafana for visualization. To run all of these
services, we’ll create a docker-compose.yaml file at the root of the project.
version: "3"

services:
  otel-collector:
    image: otel/opentelemetry-collector-contrib:latest
    command:
      - --config=/etc/otel-collector.yaml
      - --feature-gates=pkg.translator.prometheus.NormalizeName
    volumes:
      - ./o11y/otel-collector.yaml:/etc/otel-collector.yaml
    ports:
      - "4317:4317" # otlp http
      - "4318:4318" # otlp http
      - "55679:55679" # zpages

  # traces
  tempo:
    image: grafana/tempo:latest
    command:
      - -config.file=/etc/tempo.yaml
    volumes:
      - ./o11y/tempo.yaml:/etc/tempo.yaml
      - tempo-data:/tmp/tempo
    ports:
      - "4300:4317" # otlp grpc

  # logs
  loki:
    image: grafana/loki:latest
    command:
      - -config.file=/etc/loki/local-config.yaml
    ports:
      - "3100:3100"

  # metrics
  prometheus:
    image: prom/prometheus:latest
    command:
      - --config.file=/etc/prometheus.yaml
      - --web.enable-remote-write-receiver
      - --enable-feature=exemplar-storage
    volumes:
      - ./o11y/prometheus.yaml:/etc/prometheus.yaml
    ports:
      - "9090:9090"

  # visualization
  grafana:
    image: grafana/grafana:latest
    volumes:
      - ./o11y/grafana-datasources.yaml:/etc/grafana/provisioning/datasources/datasources.yaml
      - ./o11y/dashboards:/etc/grafana/provisioning/dashboards/
    environment:
      - GF_AUTH_ANONYMOUS_ENABLED=true
      - GF_AUTH_ANONYMOUS_ORG_ROLE=Admin
      - GF_AUTH_DISABLE_LOGIN_FORM=true
      - GF_FEATURE_TOGGLES_ENABLE=traceqlEditor
    ports:
      - "3000:3000"

volumes:
  tempo-data:
There’s one other service in there that ties everything together. That’s the OpenTelemetry Collector. If you noticed, we’re only configuring one method of export for logs, metrics and traces, instead of the three that would otherwise be required. Our API will instead push everything to the collector, which then knows how to distribute the data to the individual services.
This requires some configuration files. For brevity, download a copy of every
file in
this directory of
my git repository. Make sure to place it in the same o11y directory!
To finish up, open a terminal and run
docker compose up -dEach of the services will be downloaded and start up. To access Grafana, open
localhost:3000 in your browser. In the top left, click the menu, then click on
“Dashboards”. Click on “New” in the top right corner of your screen, then
“Import”. You’ll need to copy & paste, or upload each of the files in
o11y/dashboards
here.
Great, we have everything setup! If you’re not running the API already, start up the ASP.NET Core API we built. Poke around and hit a few endpoints. After a few seconds, you should start seeing data appear on the dashboard.
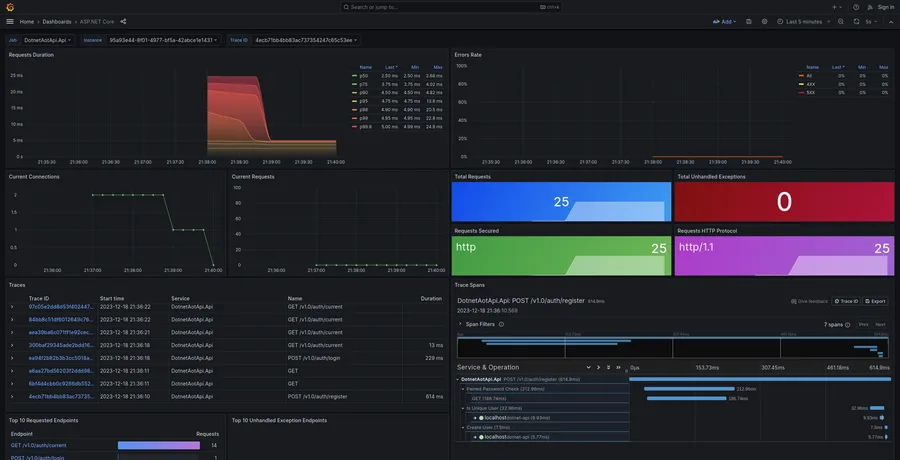
The traces visualization is the coolest part here. You can click on a row in the
“Traces” panel, and the spans will be visualized in the panel directly to the
right. These spans are hierarchical, so you can see which parts of your
application are taking the longest. You may have noticed that endpoints you
haven’t manually created a span for, still have spans being output. That’s
because of the ASP.NET Core instrumentation package! It will automatically
create a trace for every endpoint that gets hit. If you find a span for the
/hello endpoint, you should also see the span we manually added.
Further down the dashboard, you can click on an endpoint in the “Top 10 Requested Endpoints” panel to go to the Endpoints dashboard. Here, you’ll see the same things, just filtered to be data specific to that endpoint.
Down at the bottom of the dashboard, you’ll see any logs output from the API.
Wrapping up
Instrumenting an application to export logs, metrics, and traces isn’t very
difficult in the .NET Core ecosystem. There’s plenty more libraries to
automatically instrument your code, including .NET’s HttpClient, and DB
drivers like Npgsql or SqlClient. Check out the
opentelemetry-dotnet
repository on GitHub for more examples, and lists of instrumentation libraries.
Stay tuned for more implementations of observability in different languages. Rust is likely to be next! If you liked this post, share it on X, or mention me if you have questions.